Micro Economics part 4
Micro Economics part 4 is the part that covers Market, it’s type . Determination of ite equilibrium price according to syllabus of class 11
Market is a region where the buyers and sellers of a commodity come in contact with each other to effect the transactions of purchase and sale of the commodity.
Market structure is number of firms and types of firms operating in the industry.
There are three basis on which market are defined:
Nature of commodity:
If homogeneous goods are produced in a market, it is sold at a constant price. If commodity produce is of heterogeneous or differentiated in nature, it may be sold at different prices. If commodity has no close substitute, the seller can charge higher price from the buyer.
Number of buyer and sellers:
If there are large number of buyers and sellers, then buyers and sellers are not in a position to influence the price of the commodity. If, there is a single seller of a commodity, then the seller has control over a price.
Entry and exit of a firm:
If there is a free entry and exit of a firm, then the price will be stable in the long run. It is so because then the new firm enter the industry induced by large profit, then abnormal profit will be wiped out and if inefficient firms incurring losses are free to leave the industry. In short due to free entry and exit, firm earns normal profit. If there is difficult entry of a new firm (because of patent rights), then a firm can influence the price as it has no fear of competition.
Main forms of market are:
(a) Perfect competition
(b) Imperfect competition.
(i) Monopoly
(ii) Monopolistic competition
(iii) Oligopoly.
Perfect Competition is a market situation in which buyers and sellers operate freely and a commodity sells at a uniform Constant) price.
Features of Perfect Competition:
Large number of sellers and buyers:
Large number of sellers; The words ‘large number’ simply states that the number of sellers is large enough to render a single seller’s share in total market supply of the product is insignificant.
Insignificant share means that if only one individual firm reduces or raises its own supply, the prevailing market price remains unaffected.
The prevailing market price is the one which was set through the intersection of market demand and market supply forces, for which all the sellers and all the buyers together are responsible.
One single seller has no option but to sell what it produces at this market determined price. This position of an individual firm in the total market is referred to as price taker. T:his is a unique feature of a perfectly competitive market.
(ii) Large number of buyers
:The words ‘large number’ simply states that the number of buyers is large enough, that an individual buyer’s share in total market demand is insignificant, the buyers cannot influence the market price on his own by changing his demand.
This makes a single buyer also a price taker.
To sum up, the feature “large number” indicates ineffectiveness of a single seller or a single buyer in influencing the prevailing market price on its own, rendering him simply a price taker.
Homogeneous Products:
Product sold in the market are homogeneous, i.e., they are identical in all respects like quality, colour, size, weight, design, etc.
The products sold by different firms in the market are equal in the eyes of the buyers ,they cannot distinguish between the product of one firm and that of another, he becomes indifferent as to the firms from which he buys.
The implication of this feature is that since the buyers treat the products as identical they are not ready to pay a different price for the product of any one firm.
They will pay the same price for the products of all the firms in the industry. On the other hand, any attempt by a firm to sell its product at a higher price will fail.
To sum up, the “homogenous products” feature ensures a uniform price for the products of all the firms in the industry.
Free entry and exit of firms:
Buyers and sellers are free to enter or leave the market at any time they like. New firms induced by large profits can enter the industry whereas losses make inefficient firms to leave the industry.
The freedom of entry and exit of firms has an important implication. This ensures that no firm can earn above normal profit in the long run. Each firm earns just the normal profit, i.e., minimum necessary to carry on business.
Suppose the existing firms are earning above normal profits, i.e. positive economic profits. Attracted by the positive profits, the new firms enter the industry. The industry’s output, i.e. market supply, goes up.
The prices come down. New firms continue to enter and the prices continue to fall till economic profits are reduced to zero. Now suppose the existing firms are incurring losses. The firms start leaving.
The industry’s output starts falling, prices going up, and all this continues till losses are wiped out. The remaining firms in the industry then once again earn just the normal profits. Only zero economic profit in the long run is the basic outcome of a perfectly competitive market.
Perfect Knowledge about the market:
Perfect Knowledge means both buyers and sellers are fully informed about the market. The firms have all the knowledge about the product market and the input markets. Buyers also have perfect knowledge about the product market.
The implication of perfect knowledge about the product market is that any attempt by any firm to charge a price higher than the prevailing uniform price will fail.
The buyers will not pay because they have perfect knowledge. A uniform price prevails in the market. Regarding the knowledge about the input markets the implicit assumption is that each firm has an equal access to the technology and the inputs used in the technology. No firm has any cost advantage.
Cost structure of each firm is the same. All the firms have a uniform cost structure. Since there is uniform price and uniform cost in case of all firms, and since profit equals revenue less cost, all the firms earn uniform profits.
(e) Perfect mobility:
There is perfect mobility in the market both for goods and factors of production. There should be no restriction on their movement. Goods can be sold at any place.The factors of production can freely move from one place to another or from one occupation to another. Absence of transportation and selling cost.
In perfect competition, it is assumed that there is no transport cost for consumers who may buy from any firm and also there is no selling cost.
This insures existence of a single uniform price of the product.
7. Demand Curve and revenue curves under perfect competition
(a) Perfect competition homogeneous goods are produced. So, price remains constant, which makes the demand curve perfectly elastic.
(b) Homogeneous goods are produced, that is why price remains constant, as price = AR, it means AR remains constant. And if, AR remains constant, then AR = MR as per the
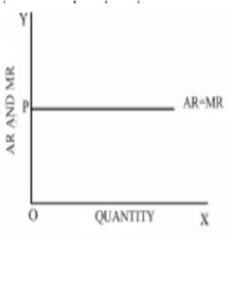
In perfect competition, industry is the price maker and firm is the price taker.
(a) In Perfect competition, homogeneous goods are produced. So, industry cannot change different price from different firms.
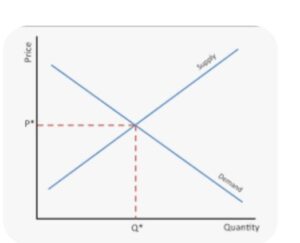
industry will give that price to the firm where industry is in equilibrium, in which Demand = Supply. Any movement from that point would be unstable.
In the above diagram, price, revenue and Cost is measured on vertical axis and units of commodity on horizontal axis. Industry will give OP price to the firm as at that point Demand = supply, i.e., industry is in equilibrium. The firms will follow the same price and charges same from the consumer.
9. Relationship between TR, AR and MR under perfect competition In the perfect competition, a firm is a price taker. It has to sell its product at the same price as given (determined) by the industry. Consequently,
price = AR = MR.,
Firm’s AR and MR curve will be a horizontal straight line parallel to X axis.
Since price remains the same, i.e., MR is constant, therefore, TR increases at the constant rate as increase in the output sold.
TR curve facing a competitive firm is positively sloped straight line. Again, because at zero output Total Revenue is zero therefore, TR curve passes through the origin O as shown in the figure.
Break-even Point
Break-even point is the level of output at which total cost of production (Fixed Cost + Variable Cost) per unit just equals to Total Revenue.
At this point the firm has neither profit nor loss. In other words, firm gets only normal profit, which is included in total cost.
Normal profit is a minimum profit, that a firm must get to remain in Production.
Shutdown point:
Shutdown point is a point where a firm is indifferent between whether to produce or shutdown. In other words, it is a situation when a firm is able to cover its variable costs only.
The condition of shutdown point is:
Price = Minimum of SAVC (Short run average variable cost)
Multiply by output
Price x output = SAVC x output
Determination of Market Equilibrium under Perfectly Competitive Market
1. Market equilibrium is that point which has come to be established under a given condition of demand and supply and has a tendency to stick to that level, i.e. where Demand = Supply.

If due to some disturbance we divert from our position the economic forces will work in such a manner that it could be driven back to its original position, i.e., where Demand = Supply. In short it is the position of rest.
It can be explained with the help of the schedule and diagram:
In the given schedule market equilibrium is determined at Price Rs. 3 where Market demand is equal to Market Supply.
At price 1 and 2, there is excess demand, which leads to rise in price, resulting tendency is expansion in supply.
Similarly, at price 4 and 5, there is excess supply, which leads to fall in price, resulting tendency is Contraction in supply.
Price quantity demanded quantity supplied
1 5 1 excess demand
2 4 2 “
3 3 3
4 2 4 excess supply
5 1 5 “
In the given diagram, price is measured on vertical axis, whereas quantity : demanded and supply is measured on horizontal axis.
(ii Suppose that initially the price in the market is P1. At this price, the consumer demand P1B and the producer supply P1A, i.e. consumers want more than what the producer are willing to supply. There is excess demand equal to AB. So, price cannot stay on P1 as excess demand will create competition among the buyers and push the price up till we reach equilibrium.
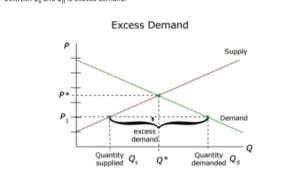
Due to rise in price from P to P1 there is upward movement along the supply curve (expansion in supply) and upward movement along the demand curve (contraction in demand)
(iii) Similarly, at price supplied P2L. There is excess supply, equal to KL, which will create competition among the sellers and lower the price. The price will keep falling as long as there is an excess supply.
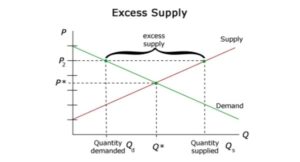
Due to fall in price from P2 to P there is downward movement along the supply curve (contraction in supply) and downward movement along the demand curve (expansion in demand) .
The situation of zero excess demand and zero excess supply defines market equilibrium (E). Alternatively, it is defined by the equality between quantity demanded and quantity supplied. The price P is called equilibrium price and quantity Q is called equilibrium quantity.
Effect of Change in Equilibrium due to Increase and Decrease in Demand and Supply
Case I: Increase in Demand
An increase in demand leads to rightward shift of demand curve as shown in the figure below:
When demand increases, then shifting should be such that initial price remains constant. It is so because increase in demand is the part of the shift in demand in which other factor changes and price remains constant.
Changes in Demand
:Due increase in demand (shift in demand) as price rises because of excess demand which leads to upward movement along the demand curve. As price rises because of excess demand which leads to upward movement along the supply curve.
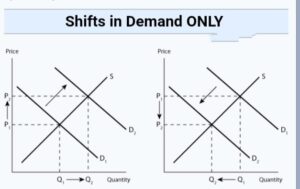
In the above figure price is on vertical axis and quantity demanded and supplied is on horizontal axis. But due to increase in demand due to the following reasons the demand curve shifts rightward from D1D1 to D2D2. The price of commodity rises from OP – OP1
(i) Price of substitute goods rises.
(ii) Price of complementary goods falls.
(iii) Income of a consumer rises in case of normal goods.
(iv) Income of a consumer falls in case of inferior goods.
(v) When preferences are favourable.
Due to increase in demand,
(i) Equilibrium price rises from OP to OP1
(ii) Equilibrium quantity also rises from OQ to OQ1
Case II: Decrease in Demand
A decrease in demand leads to leftward shift of demand curve as shown in the above figure:
When demand decreases, then shifting should be such that initial price remains constant. It is so because decrease in demand is the part of the shift in demand in which other factor changes and price remains constant.
Changes in Demand:
Due to decrease in demand (shift in demand) , price fall because of excess supply which leads to downward movement along the demand curve.
price fall because of excess supply which leads to downward movement along the supply curve.
(i) Price of substitute goods fall.
(ii) Price of complementary goods rise.
(iii) Income of a consumer falls in case of normal goods.
(iv) – Income of a consumer rises in case of inferior goods.
(v) When a preference becomes unfavourable.
With new demand curve D2D2, there is price of commodity decline from P1 to P2
Due to this excess supply, competition among the producer will make the price fall. Due to fall in price there is downward movement along the demand curve (Expansion in demand) from B to C and similarly there is downward movement along the supply curve (contraction in supply) from A to C. So, finally, the equilibrium price falls from OP to OP1 and equilibrium quantity also falls from OQ to OQ1.
Due to decrease in demand,
(i) Equilibrium price falls from OP to OP1.
(ii) Equilibrium quantity also falls from OQ to OQ1.
Case III: Increase In Supply
1. An increase in supply leads to rightward shift of supply curve as shown in the below figure:
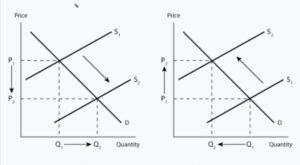
When supply increases, then shifting should be such that initial price remains constant. It is so because increase in supply is the part of the shift in supply in which other factor changes and price remains constant.
Changes in Supply:
Due to increase in supply (shift in supply) price falls because of excess supply which leads to downward movement along the supply curve price falls because of excess supply which leads to downward movement along the demand curve. as the supply increases S1 to S2 the price reduces from P1 to P2
Due to increase in supply due to the following reasons:
(i) Fall in the prices of remuneration of factors of production.
(ii) Fall in the prices of other commodities.
(iii) Improvement in technology.
(iv) Change in objective of producer (inducing them to increase supply at the same price.)
Decrease in Supply
A decrease in supply leads to leftward shift of supply curve as shown in the above figure.When supply decreases, then shifting should be such that initial price remains constant. It is so because decrease in supply is the part of the shift in supply in which other factor changes and price remains constant The supply curve shift S1 to S2 the price of commodity rise from P1 to P2
Due to decrease in supply due to the following reasons the supply curve shifts leftward from S1 to S2
(i) Rise in the prices of remuneration of factors of production.
(ii) Rise in the prices of other goods.
(iii) When the technology becomes outdated.
(iv) Change in objective of producer (inducing them to decrease supply at the same price).
(v) Taxation policy of government
Due to decrease in supply,
(i) Equilibrium price rises from OP to OP1
(ii) Equilibrium quantity falls from OQ to OQ1
Simultaneously Increase and Decrease in Demand and Supply
Case I: Both Demand and Supply Increases: When both demand and supply increases, then there are three possibilities: When Demand and Supply both Increase at the Same Rate
When demand and supply both increase at the same rate, equilibrium price remains constant and equilibrium quantity rises. It can be shown with the help of the following diagram. 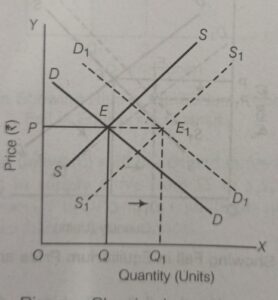
When demand and supply both increase at the same rate, then equilibrium price remains constant.
We assume that initial price is OP and equilibrium quantity is OQ as shown above:
In the above diagram price is measured on vertical axis and quantity demanded and supplied is measured on horizontal axis.
But when, “demand and supply both increase at the same rate”, then,
Equilibrium price remains constant at OP and
Equilibrium quantity rises from OQ to OQ1
Case B: When demand increases, supply also increases but at a much faster rate .When demand increases, supply also increases but at a much faster rate, then equilibrium price falls and equilibrium quantity rises as shown below:
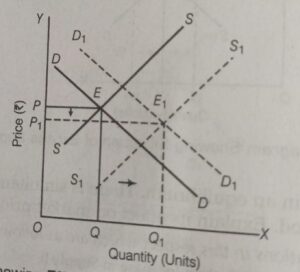
We assume that initial price is OP and equilibrium quantity is OQ as shown above:
In the above diagram price is measured on vertical axis and quantity demanded and supplied is measured on horizontal axis. But when “demand increases and supply also increases but at a much faster rate”, then,
(i) Equilibrium price falls from OP to OP1 and
(ii) Equilibrium quantity rises from OQ to OQ1
Case C: When supply increases, demand also increases but at a much faster rate
When supply increases, demand also increases but at a much faster rate, then equilibrium price rises and equilibrium quantity rises as shown below: 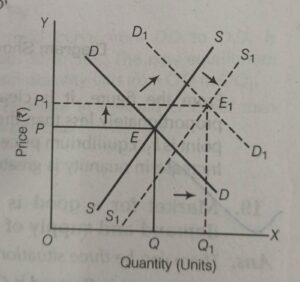
We assume that initial price is OP and equilibrium quantity is OQ as shown above:
In the above diagram price is measured on vertical axis and quantity demanded and supplied is measured on horizontal axis.
But when “supply increases and demand also increases but at a much faster rate” then,
(i) Equilibrium price rises from OP to OP1 and
(ii) Equilibrium quantity also rises from OQ to OQ1.
Case II: Both Demand and Supply Decreases: When both demand and supply decreases, then there are three possibilities:
Case A: When Demand and Supply both Decrease at the Same Rate. When demand and supply both decrease at the same rate, equilibrium price remains constant and equilibrium quantity falls as shown below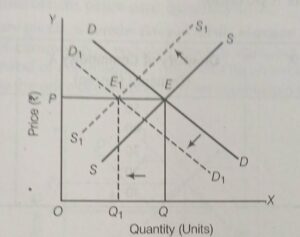
When demand and supply both decrease at the same rate, equilibrium price remains constant.
We assume that initial price is OP and equilibrium quantity is OQ as shown above:
Price is measured on vertical axis and quantity demanded and supplied is measured on horizontal axis. But when “demand and supply both decrease at the same rate” then,
(i) Equilibrium price remains constant at OP1 and
(ii) Equilibrium quantity falls from OQ to OQ1.
Case B : When demand decreases, supply also decreases but at a much faster rate
When demand decreases, supply also decreases but at a much faster rate, then equilibrium price rises and equilibrium quantity falls as shown below: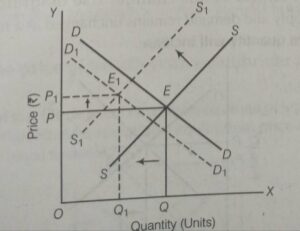
We assume that initial price is OP and equilibrium quantity is OQ as shown above:
In the above diagram price is measured on vertical axis and quantity demanded and supplied is measured on horizontal axis.
(b) But when “demand decreases, supply also decreases but at a much faster rate” then,
(i) Equilibrium price rises from OP to OP1 and
(ii) Equilibrium quantity falls from OQ to OQ1.
Case III: When supply decreases, demand also decreases but at a must faster rate
When supply decreases, demand also decreases but at a much faster rate, then equilibrium price and equilibrium quantity both falls as shown below:
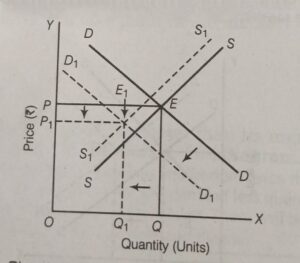
We assume that initial price is OP and equilibrium quantity is OQ as shown above:
(a) In the above diagram price is measured on vertical axis and quantity demanded and supplied is measured on horizontal axis.
(b) But when “supply decreases, demand also decreases but at a much faster rate” then,
(i) Equilibrium price falls from OP to OP1 and
(ii) Equilibrium quantity falls from OQ to OQ1
Shift in Demand and Supply in Opposite Direction
Case I: When demand increases and supply decreases at the same rate
When demand increases and supply decreases but at the same rate, then equilibrium price rises and equilibrium quantity remains constant as shown below: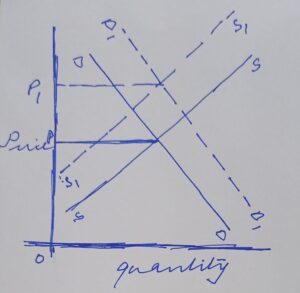
We assume that initial price is OP and equilibrium quantity is OQ as shown above:
(a) In the above diagram price is measured on vertical axis and quantity demanded and supplied is measured on horizontal axis.
(b) But when, “demand increase and supply decreases but at the same rate”, then,
(i) Equilibrium price rises from OP to OP1 and
(ii) Equilibrium quantity remains constant at OQ.
Case II: When demand decreases and supply increases at the same rate
1. When demand decrease and supply increases but at the same rate, then equilibrium price falls and equilibrium quantity remains constant as shown below:
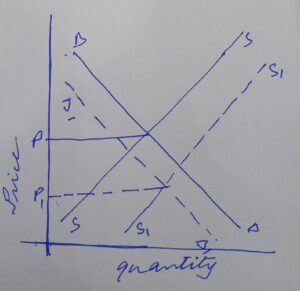
We assume that initial price is OP and equilibrium quantity is OQ as shown above: (a): In the above diagram price is measured on vertical axis and quantity demanded and supplied are measured on horizontal axis.
(b) But when , “demand decreases and supply increases but at the same rate”, then, (i) Equilibrium price falls from OP to OP1 and (ii) Equilibrium quantity remains constant at OQ.
Simple Applications Of Tools Of Demand And Supply
Price Ceiling (Maximum Price Ceiling)
When the government imposes upper limit on the price (maximum price) of a good or service which is lower than equilibrium price is called price ceiling.
Price ceiling is generally imposed on necessary items like wheat, rice, kerosene etc.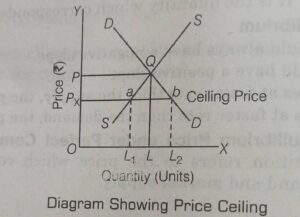
It can be explained with the help of given diagram:
In the given diagram, DD is the market demand curve and SS is the market supply curve of Wheat. Suppose, equilibrium price OP is very high for many individuals and they are unable to afford at this price. As wheat is necessary product, government has to intervene and impose price ceiling of Pt, which is below the equilibrium level.
When the government fixes the price of a commodity at a level lower than the equilibrium price (say it fixes the price at OP1, there would be a shortage of the commodity in the market. Because at this price demand exceeds supply. Quantity demanded is P1b,while quantity supplied is only P1a. There is, thus, a shortage of quantity at this price (i.e., OP1). In free market, this excess demand of Qb would have raised the price to the equilibrium level of OP. But, under government price-control consumers’ demand would remain unsatisfied.
Though the intension of the government was to help the consumers, it would end up creating shortage of wheat.
To meet this excess demand, government may use Rationing system. Under rationing system, a certain part of demand of the consumers is met at a price lower than the equilibrium price. Under this system, consumers are given ration coupons/ Cards to buy an essential commodities at a price lower than the equilibrium price from Fair price/Ration Shop. Rationing system can create the problem of black market, under which the commodity is bought and sold at a price higher than the maximum price fixed by the government.
Price Floor (Minimum Price Ceiling)
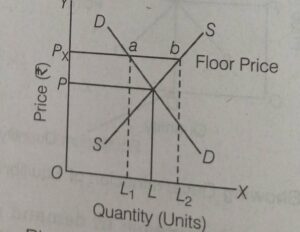 When the government imposes lower limit on the price (minimum price) that may be charged for a good or service which is higher than equilibrium price is called price floor.
Price Floor is generally imposed on agricultural price support programmes and the minimum wage legislation.
Agricultural price support programmes: Through an agricultural price support programme, the government imposes a lower limit on the purchase price for some of the agricultural goods and the floor is normally set at a level higher than the market—determined price for these good.
Minimum wage legislation: Through the minimum wage legislation, the government ensures that the wage rate of the labourers does not fall below a particular level and here again the minimum wage rate is set above the equilibrium wage rate.
3. It can be explained with the help of given diagram:
(a) In the given diagram, DD is the market demand curve and SS is the market supply curve of Wheat.
(b) Suppose, equilibrium price OP is not so profitable for farmers, who have suppose just faced Drought.
(c) To help farmers government must intervene and impose price floor of P1; which is above than equilibrium price.
(d) Since, the price P1 is above the equilibrium price P1 the quantity supplied P1B exceeds the quantity Quantity Demanded and demanded P1A. There is excess supply. Supplied of Wheat
(e) In case of excess supply, farmers of these commodities need not sell at prices lower than the minimum price fixed by the government.
(f) The surplus quantity will be purchased by the government. If the government does not procure the excess supply, competition among its sellers would bring down the price to the level of equilibrium price.
‘Mono’ means single and ‘poly’ means seller, i.e., single seller.
Monopoly is a market situation where there is a single firm selling the commodity and there is no close substitute of the commodity sold by the monopolist.
2. Reasons of Monopoly:
Grant of patent rights When a company introduces a new product or new technology it applies to the government to grant it patent certificate by which it gets exclusive rights to produce new product or use new technology.
Patent rights prevent others to produce the same product or use the same technology without obtaining license from the concerned company. Patent rights are granted by the government for a certain number of years.
Licensing by Government
A monopoly market emerges when government gives a firm license, i.e. exclusive legal rights to produce a given product or service in a particular area or region.
Forming a CarA Cartel is a group of firms which jointly set output and prices so as to exercise monopoly power.
In 1960, some oil producing companies formed a cartel, called OPEC (Organisation of Petroleum Exporting Countries).
Features of Monopoly:
(a) Single Seller
(i) There is only one seller or producer of a commodity in the market. The monopoly firm has full control over the supply of the commodity. The monopolist may be an individual, a firm, a group of firms or a government itself.
Naturally, a monopoly firm can exploit buyers by charging almost any price for its product because of exclusive control over the product.
Monopoly firm itself is the price maker and not the price taker.
Absence of close substitutes of product
(i) The product sold by the monopolist has no close substitute.
(ii) Though, some substitutes of the product may be available, yet they are not close substitutes in the sense that such substitutes are not identical products.
(c) Difficult entry of a new firm
(i) The monopolist controls the situation in such a way that it becomes very difficult for a new firm to enter the monopoly market and compete with the monopolist by producing the same product.
(ii) The monopolist tries his utmost to block entry of a new firm.
(d) Price Discrimination
Price discrimination refers to the practice of charging different prices from different buyers at the same time for the same product.
(e) Price Maker
(i) A monopoly firm has market power and is itself a price-maker. It can choose any price, it likes.
(ii) Unlike perfect competition where as output increases, price remains unchanged.
(iii) In monopoly as output increases or decreases, price changes according to what consumers are willing to pay along the demand curve. It produces and supplies a product to satisfy the entire market.(iv) It is because a monopoly firm faces the entire demand of the market, that market demand curve is said to be a constraint facing a monopoly firm.
4. Shape of demand curve under monopoly:
(a) As we know in monopoly there is a single seller or firm, that is why like an industry, single seller constitutes the entire market for the product, which has no close substitutes.
(b) So, a monopolist has full freedom and power to fix price for the product.
(c) However, demand of the product is not in the control of monopoly firm. In order to increase the output to be sold, monopolist will have to reduce the price because of price discrimination.
(d) Therefore, a monopoly firm faces a downward sloping demand curve.
(e) The elasticity of demand curve is inelastic because of no close substitute of a commodity.
5. Shape of Average revenue and marginal revenue curve under monopoly
(a) A monopoly firm faces a downward sloping demand curve as more output can be sold only by reducing the price because of price discrimination.
(b) As, we know, Price = Average revenue. So, when price falls means Average revenue falls and when Average revenue fall, then marginal revenue also falls but at a much faster rate. So, Marginal Revenue(MR) is less than Average Revenue (AR).
Monopolistic Competition
1. Meaning:
It is a market situation in which there are many firms which sell closely related but differentiated products. Market for such products are toothpaste, soap, air conditioners etc. The market is called monopolistic competition since it contains both the competitive element and monopoly element.
2. Features of monopolistic competition
(a) A large number of firms:
The number of firms selling similar product is fairly large, but not very large as in perfect competition firms are in a position to influence the price of their product .
(b) Product differentiation:
In this type of market situation a producer can produce different products, but that products should be a close substitute to each other. Product differentiation means differentiating the product on the basis of brand, colour, shape etc.Due to product differentiation each firm under monopolistic competition is in a position to exercise some degree of monopoly (inspite of large number of sellers) because buyers are willing to pay different prices for the same product produced by different firms. No doubt, producer has a control over a price, but he knows it very well to maximize the profit price has to be reduced. So, price falls under monopolistic competition due to product differentiation.
(c) Selling cost:
(i) It is the expenses which are incurred for promoting sales or inducing customers to buy a good of a particular brand.
(ii) This includes the cost of advertisement through newspaper, television and radio, and cost on each other sales promotional activities.
(d) Free entry and exit of firms:
(i) New firms can enter the market, if found profitable. Similarly, inefficient firms already operating in the market are free to quit the market if they incur losses.
(ii) It is because of this feature that like perfect competition, monopolistic competition also gives rise to normal profit.
(iii) No firm receives abnormal profit in the long run as then new firms can emerge and old ones can expand output and adjust supply with changing demand. The demand curve in monopolistic competition is highly elastic due to availability of close substitutes as a result, AR curve becomes more flatter.
Oligopoly
1. Meaning:
(a) The term oligopoly is derived from two Greek words: ‘oligoi’ means few and ‘poleein’ means ‘to sell.’
(b) Oligopoly is a market situation in which an industry has only a few firms (or few large firms producing most of its output) mutually dependent for taking decisions about price and output.
(c) William Fellner defines oligopoly as “Competition among the few”.
(d) In India, markets for carbonated beverages, “National Newspapers” market, mobile services provider, washing products, automobiles, cement, aluminium, etc., are the examples of oligopolistic market. In all these markets there are few firms for each particular product.
2. Types of Oligopoly:
(a) Pure or Perfect Oligopoly:
(i) In the case of pure oligopoly, firms produce homogenous products like copper, iron, steel and aluminium.
(ii) So, decisions by consumers to purchase the goods of a particular firm are influenced by the price considerations.
(b) Imperfect or Impure or Differentiated Oligopoly:
(i) In differentiated oligopoly, firms produce differentiated products such as toilet soap, cigarettes or soft drinks.
(ii) The goods produced by different firms have their own distinguishing characteristics, but they are close substitutes of each other.
(c) Collusive Oligopoly:
If the firms cooperate with each other in determining price or output or both, it is called collusive oligopoly or cooperative oligopoly.
(d) Non-collusive Oligopoly:
If firms in an oligopoly market compete with each other, it is called a non-collusive or non-cooperative oligopoly.
3. Features of Oligopoly
(a) Few Large Sellers:
(i) The number of sellers in an oligopoly market is small – when there are two or more than two, but not many sellers.
(ii) What matters is that these few sellers account for most of the industry’s sales.
(iii) These “few” sellers consciously dominate the industry and indulge in intense competition. Each firm is aware of that it possesses a large degree of monopoly power.
(iv) For example, the market for mobile service provider in India is an oligopolist structure as there are only few producers of mobile service provider. There exists severe competition among different firms and each firm tries to manipulate both prices and volume of production to outsmart each other.
(b) Interdependence of Decisions:
(i) Interdependence means that actions of one firm affects the actions of other firms.
(ii) Since the number of sellers is small, each firm has to take into consideration the possible reaction of its competitors, when making decisions.
(iii) The business decision of a single seller will have a substantial impact on the product price, output and profits of the rival firms.
(iv) For example in the “National Newspapers” market, when the “Economic Times” introduced invitation pricing policy—they offered the newspaper at a price of Rs.1.50 on weekdays. The Hindustan Times was forced to reduce its prices from Rs. 2.50 per copy to ? 1.50 per copy on weekdays. When Hindustan Times was celebrating its 75 years of service, they offered the newspaper at Rs. 1/- weekdays. The Times of India responded by matching the price cut.
(c) Non-Price Competition:
(i) Oligopoly firms try to avoid price competition for the fear of price war.
(ii) They use non-price competition methods like better services to customers, advertising, etc. to compete with each other.
(iii) Oligopoly firms are in a position to influence the prices. However, they follow the policy of price stability or price rigidity.
(iv) Price rigidity refers to a situation in which whether there is change in demand and supply the price tends to stay fixed.
(v) If a firm tries to reduce the price the rivals will also react by reducing their prices. Likewise, if it tries to raise the price, other firms will not do so. It will lead to loss of customers for the firm which intended to raise the price.
(vi) So, firms prefer non-price competition instead of price competition.
(d) Barriers to the entry of firms:
(i) The main reason why the number of firms is small is that there are barriers which prevent entry of firms into industry.
(ii) Patents, large capital, control over the crucial raw material etc., prevent new firms from entering into industry.
(iii) Only those who are able to cross these barriers are able to enter.
(e) Role of selling costs:
(i) Due to severe competition and interdependence of the firms various sales promotion techniques are used.
(ii) For example, T.V. commercials war between pepsi and coke.
(iii) It relies more on non-price competition.
(f) Oligopoly firms may produce either a homogeneous or a differentiated product.
(i) Oligopoly firms may sell homogeneous products such as steel, aluminium, LPG cylinders etc. They are called pure oligopolies, as the products of the respective firms are indistinguishable.
(ii) Firms producing differentiated products are called impure oligopolies.
(iii) In case of a pure oligopoly market situation rival firms will rely on “price” or “lowercosts” to compete in the market.
(iv) On the other hand, in case of impure oligopolies, with firms producing differentiated products, firms can use “product variations” and “promotional” strategies to compete.
(g) Group Behavior:
(i) In an oligopoly situation, there are a few firms who control the entire market and each firm recognizes interdependence in their decision-making.
(ii) So, price-output decisions of a particular firm directly influence the competing firms.
(iii) Instead of independent price and output strategy, oligopoly firms prefer group decisions that will protect the interest of all the firms.
(iv) Group Behaviour means that firms tend to behave as if they were a single firm even though individually they retain their independence.
(h) Indeterminate demand curve facing an oligopoly firm:
(i) The most distinguishing feature of oligopoly is the “interdependence in decision making” of the rival firms.
(ii) The consequence of such interdependence is the high degree of uncertainty regarding the reaction pattern of rival oligopolists.
(iii) Interdependence and uncertainly result in “indeterminateness of the demand curve” facing an oligopolist. The firm cannot assume that his rivals will not react to its decision regarding change in its variables.
(iv) The demand curve facing an oligopoly firm keeps shifting as rival firms react to changes made by this firm. The demand curve thus loses its definiteness and determinateness.
Read More: Micro Economics part 2